
Sep 16, 2026
report builder examples, golf tournament reports, report templates, golf event software, Live Tourney
Explore 7 report builder examples, from scorecards and tee sheets to dashboards and payouts, with practical tips for choosing and customizing templates.

A useful golf report isn't just a polished page. It has to match the event format, staff workflow, player needs, and the way the material will be printed, shared, or viewed on a phone. That's why the best report builder examples start with a real deliverable, then connect the right fields to the people who use them.
The seven examples below cover golf-specific materials such as scorecards, tee sheets, cart signs, and bag tags, along with broader tools for dashboards, operational documents, form-driven reporting, and embedded reporting. The strongest templates rely on dependable event data, clear hierarchy, and only the fields each audience needs. That discipline matters because automated reporting can save working time for other tasks at scale, with 95% of surveyed respondents in one academic study reporting time savings from report automation (Aalto University study). For a practical event-reporting perspective, see Corporate Challenge Events' reporting advice.
1. Live Tourney
Live Tourney is the most direct fit when the report is part of the golf event itself. Its web-based tournament platform connects a customizable report builder to the same live event data used for scoring and leaderboards, so staff can produce scorecards, tee sheets, cart signs, bag tags, and final results without maintaining separate spreadsheets or document templates.
That connection is the important part. A scorecard should reflect the actual roster, holes, tees, formats, and pairings. A tee sheet needs the correct groups and start information. A cart sign needs names, course details, tee markers, and branding. When those documents draw from the event record, staff can update the source once instead of correcting every printed output manually.
A practical golf report structure
A strong Live Tourney template separates reusable design elements from event data. The layout can contain logos, text boxes, QR codes, scorecard tables, and other objects, while the event supplies player names, pairings, tees, scores, and schedule details. That makes it possible to create one professional design and reuse it across outings, leagues, and tournament formats.
The platform supports formats including single-round and multi-round events, match play, Ryder Cup, and round robin. Its back-office workflow also includes roster uploads, registrations, payments, side games, and a payouts calculator, which makes operational reporting more useful than a score-only document.
Practical rule: Build the report around the staff decision it supports. A player needs a readable scorecard. The starter needs a clean tee sheet. The event director needs results, payouts, and exceptions.
Live Tourney reports are especially useful when staff need fast setup and app-free participation. The company reports 3x faster setup, 10,000+ events, and 1M+ holes scored on its product materials (Live Tourney Features). Those figures are product-reported, but they point to the platform's intended advantage, a simpler workflow for golf teams that don't want legacy complexity.
For more context on the scoring workflow, review Live Tourney's guide to live scorecards. The main trade-off is operational: live scoring and real-time leaderboards require reliable internet access on-site. Large facilities that depend on extensive legacy integrations may also need to confirm fit before replacing an established enterprise stack. For courses prioritizing speed, simplicity, printable tournament materials, and responsive support, this is the strongest golf-specific option in the list.
2. Google Looker Studio
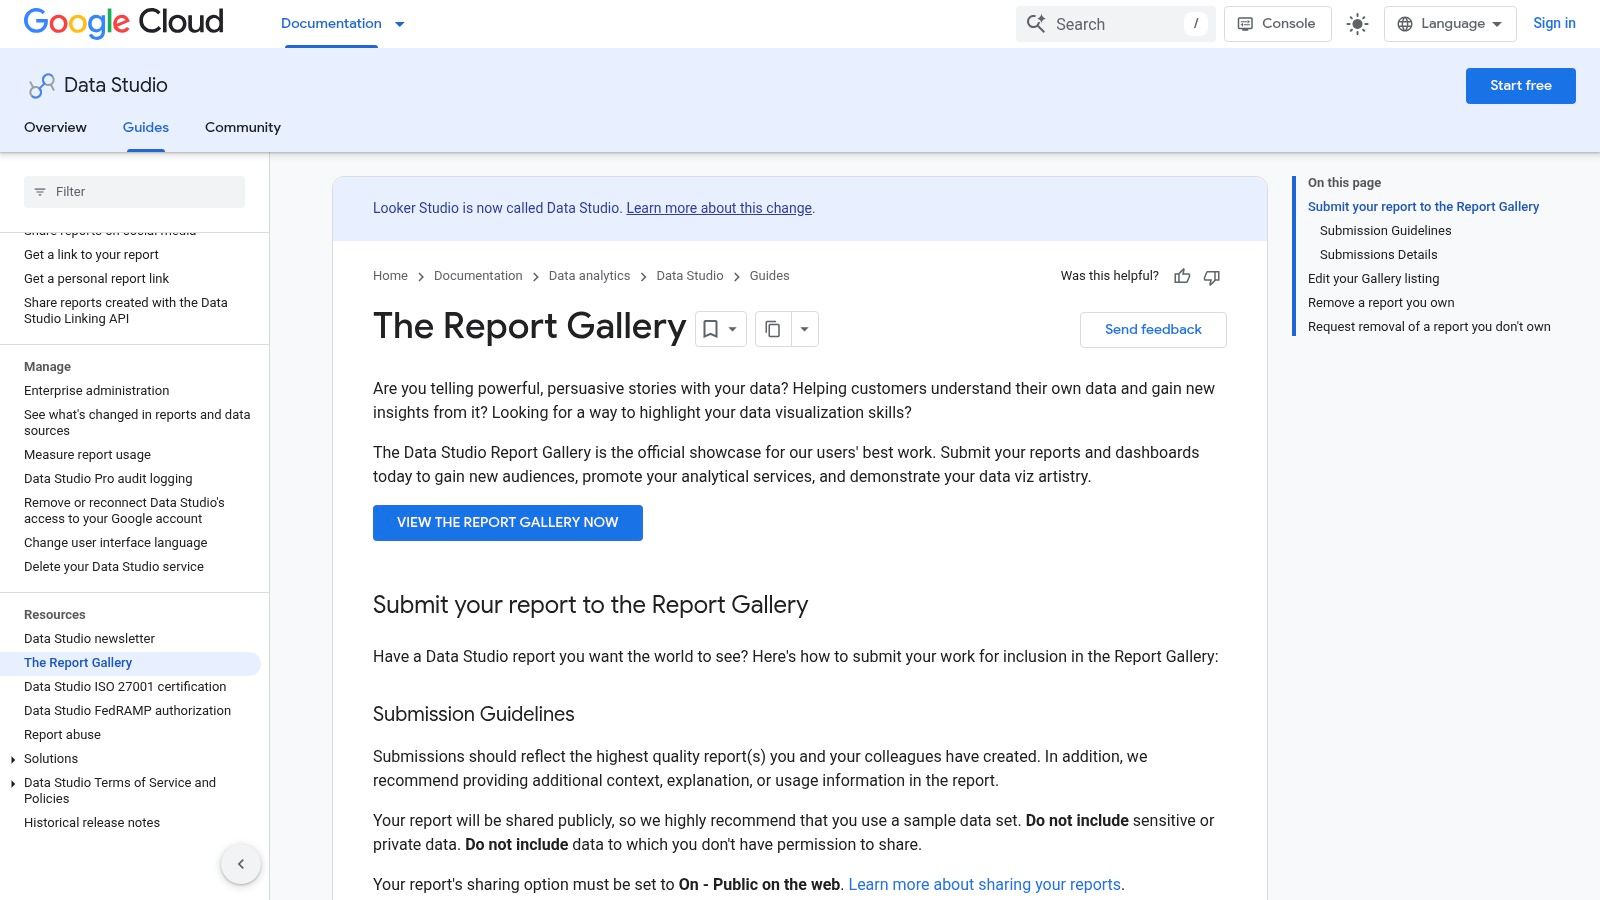
Google Looker Studio works best when the report is meant for interactive analysis, not a stack of printed tournament materials. Its public Report Gallery gives teams examples to browse, adapt, and use as visual references. A marketing team, tournament sponsor, or club administrator can use that approach to build a dashboard showing registration activity, participation, sponsorship exposure, or post-event feedback.
The browser-based workflow lowers the barrier for teams that don't want desktop software. Looker Studio can connect to Google sources such as Sheets, GA4, Ads, and BigQuery, as well as third-party connectors. Filters and date controls let users move from an overall event view into a specific campaign, league, or reporting period.
Adapt the dashboard to tournament operations
A useful golf dashboard might combine registration status, player counts, payment status, scoring activity, and sponsor metrics. It could also provide separate views for the head professional, event chair, and marketing contact. Each audience should see the metrics that support its decisions, rather than a single crowded page.
The tool is a good choice for quick sharing and browser access. It's less suitable for precise scorecard pagination, bag-tag layouts, or documents that must print consistently across different devices. Those outputs need page control, fixed positioning, and careful handling of repeated headers.
A dashboard can explain what's happening. It usually shouldn't be responsible for producing every physical item needed on tournament day.
Looker Studio also fits a team that wants to share a live reporting link after the round. For example, organizers could publish a sponsor-facing view of event activity while keeping player-level information restricted to staff. The trade-off is that advanced administration and team features may require Looker Studio Pro, and Google Cloud enablement can be confusing for new buyers. For golf teams exploring real-time tournament scoring workflows, Looker Studio is best treated as an analytical layer beside the event system, not as the source of truth for scorecards and tee sheets.
3. Microsoft Power BI Report Builder
Microsoft Power BI Report Builder fits tournament documents that must print the same way every time. It is designed for paginated, pixel-perfect reports, giving staff control over page breaks, repeated headers, columns, and fixed positioning. That makes it suitable for player lists, score summaries, invoices, payouts, cart signs, bag tags, and formal results packages.
A golf association could build one post-event report with player-level scoring, division and team summaries, and payout pages. Parameters can produce separate versions for staff, players, and sponsors without maintaining several unrelated templates. The same structure can also support a tee sheet or a printer-ready operational report, although each output still needs deliberate page design.
Where paginated reporting earns its place
Microsoft describes Report Builder as a standalone authoring tool for paginated reports. Its download information lists charts, maps, sparklines, data bars, reusable report parts, and shared datasets, with support for Windows 10 and Windows 11 plus a .NET Framework 4.6 requirement (Microsoft Report Builder download).
The practical advantage is control over repeated structures. A scorecard-style report can show each golfer's score by hole with Out, In, and Total columns, while a field summary aggregates birdies, pars, and bogeys by hole (StatCrew golf scorecard example). Another tournament format places golfer initials before a specific hole, followed by hole-by-hole scores and totals (BlueGolf score report example). Staff can adapt these layouts for results sheets, payout statements, or condensed materials for carts and registration desks.
Distribution is the main trade-off. Publishing paginated reports to the Power BI service and sharing them across an organization can introduce Power BI licensing or capacity requirements. That adds setup for a tournament team whose immediate need is printed event materials. Microsoft-heavy organizations that already govern data through Power BI and Microsoft 365 may accept that overhead for the integration. This comparison of event management software provides useful context for that workflow choice.
4. Tableau
Tableau is a strong choice when the report needs visual exploration and interaction. Its sample workbooks and Tableau Public gallery give teams a large collection of dashboards to study, copy structurally, and improve. A tournament committee can use those examples to design reports that let users filter by division, hole, team, round, or scoring category.
The best golf use case is post-round analysis. A dashboard might compare scoring patterns across holes, show how divisions performed, or help an association identify where course setup affected results. Interactive views can give an event director more context than a static results sheet, especially when different users need to explore the same data.
Strong visuals, serious governance
Tableau's community is one of its practical advantages. Staff can learn from existing examples rather than designing every visualization from a blank canvas. Built-in sample data, starter resources, training, and design guidance also help teams develop a consistent visual language.
That strength comes with a cost. Tableau uses role-based licensing, with Creator, Explorer, and Viewer roles, and the total commitment depends on whether an organization chooses Tableau Cloud or Tableau Server. A club that only needs a printable tee sheet may find the platform excessive. A golf association that wants governed analysis across seasons, events, and member groups may find the investment easier to justify.
Use Tableau for questions such as:
Hole performance: Which holes produce the most birdies, pars, or bogeys across the field?
Division analysis: How do scoring patterns differ between player groups?
Event review: Which format, course, or round creates the clearest operational issues?
Tableau shouldn't replace the operational report that a starter prints before play. It's better at helping leaders investigate patterns after the data is collected. For inspiration, browse the Tableau Public gallery, then translate the visual idea into fields that your tournament system can reliably provide.
5. Jotform Report Builder
Jotform Report Builder starts with form submissions, so its strongest tournament use is turning intake data into staff-ready documents. It fits registration summaries, RSVP tracking, volunteer assignments, feedback reports, and sponsor surveys better than scoring analysis.
A charity outing can collect guest names, meal choices, shirt sizes, sponsorship details, and attendance confirmations through Jotform forms. The builder can convert those submissions into charts, tables, and printable PDFs. Small event teams can produce a usable report without first creating a full business-intelligence model.
Strong for intake, limited for scoring
The main benefit is the short path from collection to output. Templates and examples for surveys, events, and registrations give nontechnical staff a starting structure they can adapt to the event's deliverables.
Useful outputs include:
Registration report: List confirmed players, incomplete forms, meal selections, and special requests for check-in staff.
Volunteer report: Group marshals, check-in staff, and banquet support by assignment so coordinators can print staffing lists.
Feedback report: Summarize post-event responses and separate sponsor comments from player feedback.
The same structure can support cart-sign or bag-tag requests when those details are collected through a form. It can also produce a sponsor fulfillment checklist, although staff should verify the source fields before printing.
The trade-off is data complexity. Jotform is not designed for heavy analytics, complex joins, or the relational scoring model required for hole-by-hole results, handicaps, pairings, and payouts. Advanced quotas and features depend on the selected Jotform plan.
Use Jotform when the report follows a form. Keep scoring, pairing, and payout data in the specialized golf platform that already manages it. A form-driven workflow can complement existing event software, but it should not make staff re-enter information that is already available in the tournament system.
6. Telerik Reporting
Telerik Reporting is aimed at teams that need to embed report generation inside a custom application. It offers web and desktop designers, browser-based demonstrations, and a Web Report Designer that can support end-user editing. That makes it relevant to software companies building tournament-management products, club portals, or internal operations systems.
A developer could use Telerik to create a report designer for documents such as invoices, player statements, cart signs, or payout summaries. The application would supply the event data, while the reporting layer controls layout, parameters, export behavior, and user permissions.
A developer-led fit
The suite supports multiple frameworks, including ASP.NET Core, Blazor, React, Angular, WPF, and WinForms, and it offers export options across common business formats. An optional on-premise Report Server can handle scheduling and distribution. Those features matter when a reporting function must live inside an existing product rather than operate as a separate SaaS dashboard.
A golf software team might expose a controlled editor where an administrator changes a logo, moves a field, or adds a sponsor message without asking engineering to rebuild the report. The developer still owns the data model and integration, which helps protect consistency across event formats.
Design decision: Give end users control over presentation, but keep scoring rules and source-data definitions under application control.
The downside is implementation effort. Telerik is better suited to a developer-led deployment than to a tournament director who wants to create a report immediately. Teams must plan the data connection, authentication, deployment, and maintenance work before the report reaches staff.
Its reporting demos are useful for evaluating the interaction model. If the requirement is embedded reporting in a custom golf application, Telerik deserves serious consideration. If the requirement is only to produce tomorrow's tee sheets, a specialized tournament platform will usually involve less engineering.
7. Stimulsoft Reports
Stimulsoft Reports targets organizations that need cross-platform, pixel-perfect operational documents. Its suite covers JavaScript, .NET, Java, PHP, and Python, with designers, viewers, cloud options, SDKs, and a broad collection of sample reports. That combination makes it suitable for products that need to generate labels, statements, tags, forms, or branded PDFs across different technology environments.
For golf, the clearest applications are bag tags, cart signs, player statements, payout documents, and other fixed-layout materials. A software provider could embed a report designer into a web application, let administrators adjust branding, and export the finished document for printing or sharing.
Broad platform coverage, more licensing decisions
The sample reports and online demos help teams evaluate visual output before committing to an implementation. The platform also supports a wide range of export formats, including PDF, Excel, Word, and HTML. Its cloud offering can suit teams that want web access, while platform SDKs support organizations with an existing application stack.
That flexibility is valuable for a vendor serving multiple golf facilities or building a multi-tenant tournament product. It's less valuable to a single course that only needs event-day materials and doesn't have developers available to maintain a reporting layer.
The main trade-off is evaluation complexity. Stimulsoft's licensing matrix includes multiple products, platforms, and deployment choices, so buyers need to map the exact scenario before comparing costs. A 30-day free trial and published online purchasing options can help with that process, but the team still has to identify whether it needs cloud reporting, embedded designers, runtime components, or a combination.
Review the Stimulsoft Reports platform with one real document, such as a cart sign or bag tag, rather than a generic dashboard. Test the fields, page size, branding, export, and editing permissions. That will reveal whether the suite's breadth solves a real requirement or adds options the event team won't use.
Top 7 Report Builders, Feature Comparison
Product | Complexity 🔄 | Resources ⚡ | Expected outcomes 📊 | Ideal use cases 💡 | Key advantages ⭐ |
|---|---|---|---|---|---|
Live Tourney | Low, web-based, minutes to set up | Low, basic devices and reliable internet required | High, real-time scoring, polished print-ready event materials | Golf courses & event organizers running app-free tournaments | App-free live scoring + customizable report builder; fast setup |
Google Looker Studio | Low, template-driven, browser-based | Low, free to use; best with Google data connectors | Good, shareable interactive dashboards and reports | Marketing/analytics teams needing quick, shareable reports | Deep Google ecosystem connectors; free and easy to start |
Microsoft Power BI Report Builder | Moderate, desktop paginated authoring (RDL) | Medium, free locally; org sharing needs Power BI licensing | High, pixel-perfect PDFs and multi-page printable reports | Operational/print-focused reporting (invoices, scorecards) | Pixel-perfect paginated output; integrates with Power BI/MS365 |
Tableau | High, powerful interactive design, steeper learning curve | High, role-based licensing and deployment costs | High, highly interactive, design-first dashboards | BI teams prioritizing visual best practices and interactivity | Market-leading interactivity, strong community and resources |
Jotform Report Builder | Low, no-code drag-and-drop designer | Low, minimal setup; advanced features depend on plan | Fair, quick operational reports and printable PDFs | Small orgs, surveys, event registrations tied to forms | Very fast time-to-value and seamless form integration |
Telerik Reporting | High, developer-led integration and embedding | High, .NET dev resources; optional on-prem server | High, embeddable designers, multi-format exports | Teams embedding report builders into custom apps | Mature embedding story and web report designer demos |
Stimulsoft Reports | High, flexible cross-platform SDKs and SKUs | High, dev resources and licensing evaluation required | High, pixel-perfect documents with broad export support | Cross-stack app embedding and operational document generation | Broad tech coverage and 40+ export formats |
Turn a Template Into a Repeatable Tournament System
The best report builder examples don't begin with a chart type. They begin with a staff member, a decision, and a document or view that must work under event pressure. A tee sheet serves starters and players. A cart sign identifies a group at the course. A bag tag supports logistics. A payout report gives the event director a controlled summary. A live leaderboard keeps participants connected to the round.
Before adapting any template, define the report's audience. Then choose the delivery format. A PDF or print layout suits scorecards, signs, tags, and formal results. A browser dashboard suits live analysis and sponsor reporting. A scheduled operational report may suit managers who need a recurring summary without opening the event system.
Keep only essential fields. Group information by workflow, not by database table. Test the layout with real event data, including long names, missing values, multiple rounds, unusual pairings, and blank scoring cells. Microsoft's paginated-report guidance warns that empty chart values can appear as visible gaps and that poor layout choices can create blank pages or excessive whitespace (Microsoft guidance on empty and null data). Those edge cases deserve testing before staff print hundreds of pages.
Also build an exception view. IBM's traceability guidance describes reports that show coverage, gaps, and missing links, a useful model for tournament operations when staff need to know what hasn't been completed (IBM traceability report guidance). In golf, that could mean missing player details, incomplete pairings, unassigned tee times, absent scores, or unsettled payouts.
Google Looker Studio and Tableau fit interactive analysis. Jotform fits form-driven registration and feedback reporting. Power BI Report Builder, Telerik, and Stimulsoft fit pixel-perfect or developer-led reporting. Live Tourney is the most directly aligned option for courses that need scorecards, tee sheets, cart signs, bag tags, payouts, and live tournament data in one workflow.
Live Tourney connects a customizable report builder with app-free live scoring, leaderboards, roster management, payments, side games, payouts, and golf-specific event formats. Visit Live Tourney to see how your course can turn one reliable event record into the reports and materials staff need from registration through final results.





