· 14 min read
Dashboard and Reporting Tools for Event Teams
Dashboard and reporting tools help golf teams act on live scores, sign-ups, and payouts while the round is still moving.
The starter needs the latest pairings, someone at the counter is asking whether their entry fee cleared, and the bag room has a cart sign for a player who withdrew. Meanwhile, your assistant is trying to work out which spreadsheet is current. Dashboard and reporting tools should settle those questions while you're running the event, not give you another screen to maintain.
For a head pro or tournament coordinator, the useful test is simple: can the right person find a trustworthy answer and act on it without calling you over?
What Staff Can See Before the First Tee
Tournament morning starts with people looking for different facts. The starter needs pairings and tee times. The desk needs to know who has paid. Players finishing their round want the leaderboard before they leave the final green.
Those facts need a visible home, but they don't all belong on the same crowded screen. Build each view around a decision, then give the person responsible a direct route to it.
In a historical survey of business-intelligence professionals, the TDWI Best Practices Report found that 79% said visualization increased user adoption to a high or very high degree, while nearly 85% considered visualization highly important in dashboards, compared with 33% for online analytical processing tools. For an event operator, the useful distinction is between information staff can immediately read and information they must stop working to analyze.
Views a tournament desk should be able to open
| View | What it shows | Who reads it | Decision it settles |
|---|---|---|---|
| Live leaderboard | Current scores, positions, and holes completed | Players, committee, and desk | Who is leading and how the field stands |
| Registration and payments | Sign-ups, fees collected, and open spots | Event coordinator | Whether the field is full and who still owes |
| Scoring progress | Groups finished versus still on the course | Tournament desk | Which groups are behind or missing scores |
| Tee sheet | Tee times, pairings, and starting holes | Starter | Who goes off, when, and from where |
| Scorecard | Hole-by-hole scores for each player | Players and committee | The official result for that competitor |
| Cart signs and bag tags | Names, cart numbers, and starting holes | Bag room and starters | How to stage carts and bags |
| Payout summary | Places, side games, and amounts owed | Committee | Who gets paid and how much |
| Pace of play | Time gaps or slow groups | Marshal | Which group needs a nudge |
The table is a working inventory, not a requirement to display everything at once. A starter shouldn't have to scan payment totals to find a replacement player's starting hole. A committee member checking side-game results shouldn't need access to edit pairings.
Give each view an owner
Start with clean roster management. A duplicate player entry or an outdated withdrawal can affect the tee sheet, bag tags, and payment status before anyone enters a score.
Then assign responsibility. The registration coordinator confirms that a vacancy is available before offering it to the waitlist. The scoring desk checks a missing entry before telling the marshal that a group is behind. An empty score field isn't proof of slow play.
Make status labels explicit, too. Registered, paid, checked in, and started describe different things. Combining them into a single green check leaves staff guessing.
Before your next event, mark the three views staff will open before the first group tees off. Treat every other chart as optional until those views are accurate, readable, and trusted.
How a Live Dashboard Differs from a Finished Report
A live dashboard is like the starter's radio. A finished report is like the card in a player's hand. They describe the same event, but one supports changing instructions while the other gives someone a stable reference.
A dashboard shows something still happening. A report preserves a particular state. Neither replaces the other, and choosing only one leaves part of the operation unsupported.
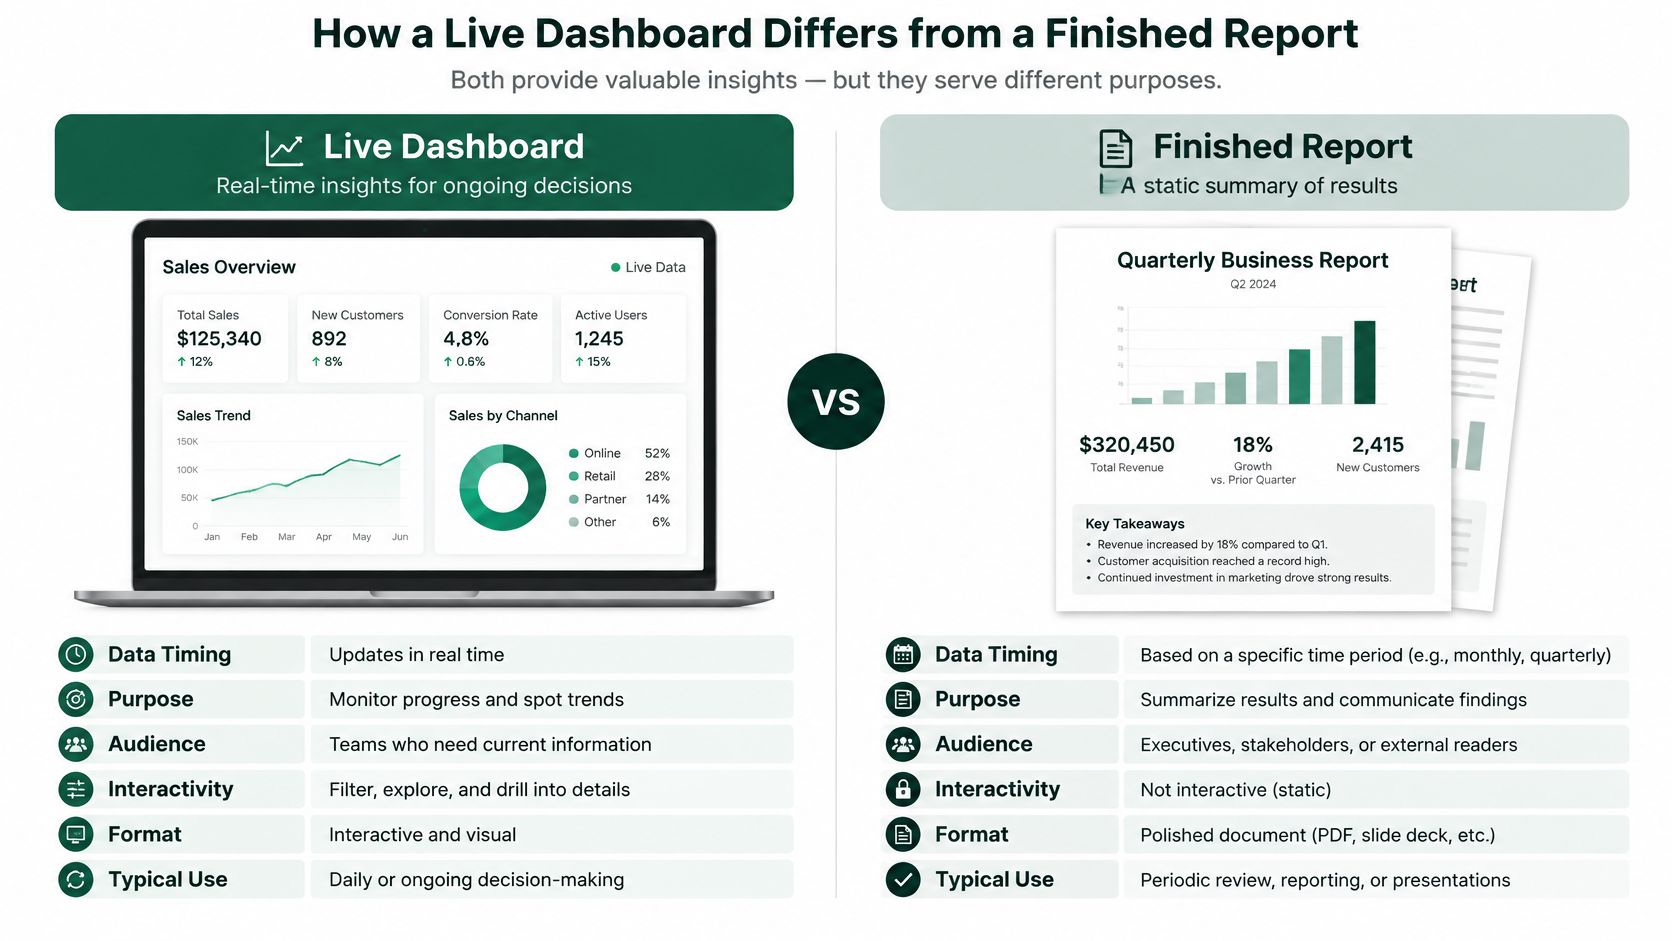
Dashboard versus finished report
| Question | Live dashboard | Finished report |
|---|---|---|
| When people look | While the round or registration window is open | Before players arrive or after results are official |
| What can change | Scores, spots, and status update as play continues | A snapshot that stays put once printed or sent |
| Typical output | Leaderboard or status screen on any phone | Scorecard, tee sheet, cart sign, bag tag, or payout sheet |
| Best question | Who is leading, who is out, and who has not paid | What do we hand a player or file for the committee |
Consider a scoring correction. A player's entered score is wrong, the committee verifies the card, and an authorized staff member makes the correction. The live standings should reflect the accepted change, while the next generated results report should use that same corrected record.
That doesn't mean an old printout changes. It means staff shouldn't have to repair a dashboard, a spreadsheet, and a payout document separately.
Keep the record connected
A players' tournament leaderboard should distinguish provisional standings from approved results. Otherwise, players may treat an unfinished leaderboard as the final outcome while groups are still submitting scores.
For a related sports context, Vanta Sports' resource on youth sports performance tracking tools is useful when considering how ongoing tracking differs from the information a coach or organizer keeps for review. At a golf event, make that distinction concrete through clear event status and controlled result approval.
Printed documents need their own discipline. Put the event name and relevant round on each output, and identify revised versions so the bag room can discard superseded copies. Keep the approved results separately from working drafts.
Practical rule: If someone must act in the next few minutes, use a dashboard. If someone must carry it, post it, or file it, use a report.
A polished live board without usable printouts still leaves the bag room short. A stack of PDFs without a live view leaves the counter answering questions that players could settle themselves.
Design Choices That Speed Up a Busy Desk
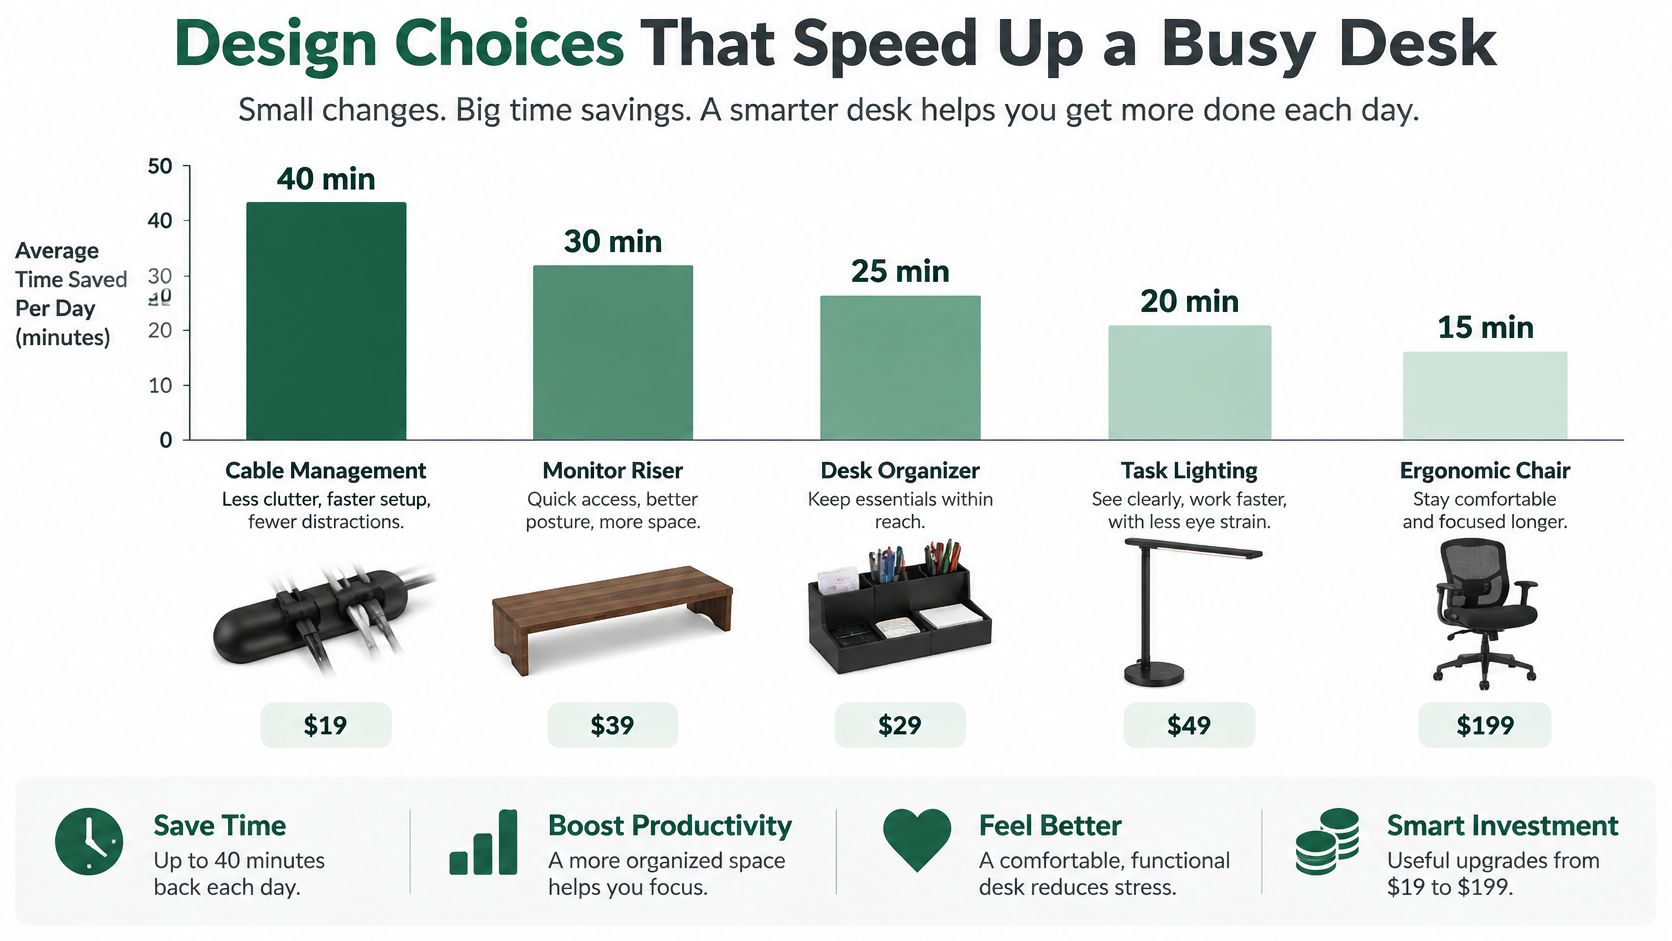
The first tee is moving, a player asks about a score, and the starter needs to find the right group quickly. A flexible report builder helps only if staff can reach the answer without rebuilding the view from scratch.
A study of pavement-management dashboards measured average data-placement time at 15.2 seconds. It also found that list filters increased cognitive load, while charts and an interactive map reduced it. Those results come from a different setting, but the practical point applies: controls should make common questions easier to answer, not turn them into a series of choices.
Start with the question staff ask
Use named views such as Still on course, Unpaid entries, and Payouts awaiting approval. Keep the selected event and round visible so staff can tell which results they're looking at.
For tournament history, provide a clear date-range control. For the current outing, let staff choose the event by its familiar name rather than assemble it from separate course, format, date, and status filters.
- Preserve useful defaults. Open the active event without making staff rebuild their selection.
- Make resets obvious. A forgotten filter shouldn't hide a group.
- Keep actions nearby. Place the option to inspect or correct an entry beside the exception.
- Show freshness. Make it clear whether scores are current or waiting to sync.
Put explanations beside the exceptions they clarify. If a posted total doesn't match a card, show the relevant scoring definition or adjustment there. Keep help available without crowding the first screen with instructions.
A quasi-experimental dashboard study found that explanatory dashboards increased the mental effort people directed toward understanding. Added goals and instructions did not significantly change cognitive load or performance. Use expandable notes and accessible help controls where they answer a real question.
Test the task, not the menu
Give a new assistant one assignment: find the group with missing scores and identify whom to contact. Watch for hesitation, misread labels, and event-selection mistakes.
A dashboard is quick when staff can reach the right answer without guessing.
Measure completion time and errors during the exercise. A polished screen that prompts the wrong call needs revision.
Jobs These Tools Take Off the Tournament Desk

A player withdraws while the coordinator is processing a replacement. The starter has an old pairing sheet, carts are already staged, and someone is checking payments. The desk needs one accepted version of the event, not another chart to manage.
Tools earn their place when they reduce handoffs between registration, pairings, play, and follow-up. If staff must re-enter information or reconcile separate lists, the reporting system has added work instead of taking it away.
Four event-day jobs and what they replace
| Job | Mess it replaces | What the tool does |
|---|---|---|
| Filling the field | A spreadsheet beside a separate payment inbox | Keeps registration and payment details together for staff to review |
| Building the day | Multiple edits to competing pairing files | Gives staff a current set of assignments to update after a change |
| Running the round | Players asking the desk for the lead | Provides live scores and a public leaderboard |
| Closing the books | Hand-kept league standings and side-game tallies | Tracks league standings and side games, with payouts checked before release |
Filling the field should give the coordinator a clear list of entries to act on. Staff need to distinguish a confirmed registration from a waitlist spot and see which entries still need attention. Without that distinction, a replacement can create confusion about whether the field is full.
Building the day carries a different risk: conflicting edits. Assign one authorized staff member to approve final pairing changes, then share the accepted assignments with the people who need them. Software can keep information consistent, but staff still need to agree on who makes the final call.
Finish the work, not just the round
During play, staff need to tell a scoring problem apart from a group that has not submitted its latest holes. A marshal needs enough context to decide whether to approach the group, rather than relying on a status marker alone.
At closeout, check eligibility, ties, and side-game rules before releasing payouts. For recurring play, Live Tourney's League Management helps organizers organize leagues, track standings, and manage schedules in one place.
Start with the job that caused the most confusion at your last event. Test that workflow from registration through its final handoff. A long feature list matters less than whether staff can trust the current information and act on it.
Reports Worth Printing Before Players Arrive
Scorecards, tee sheets, cart signs, and bag tags are tangible tests of reporting quality. Staff can judge them immediately: are the names readable, are the starting holes right, and does the paper fit the holder or tag stock you use?
A customizable builder should let staff produce those materials from the accepted roster and pairings. After a change, they should be able to regenerate the affected documents without typing the replacement player's name into separate templates.
Build around the physical output
- Scorecards. Keep player identification, hole information, and scoring fields legible when printed, not merely attractive on screen.
- Tee sheets. Make starting times, starting holes, and group membership easy to scan at the staging area.
- Cart signs. Match the printed size to your holders and keep assignment details prominent.
- Bag tags. Prioritize the information the bag room needs to place equipment correctly.
Check the actual printer, paper orientation, margins, and text wrapping before event morning. A long surname that disappears off the edge of a cart sign is a reporting defect, even if the underlying roster is correct.
Research from BARC and the Eckerson Group, summarized by Pie Chart Generator, found that 73% of data and analytics leaders identified self-service report and dashboard authoring as the leading technical driver of adoption, compared with 48% for data preparation and 38% for embedded BI. The practical requirement is straightforward: a head pro shouldn't need a vendor analyst to move a name on a cart sign.
Keep document preparation in staff hands
Live Tourney includes a Customizable Report Builder and can generate scorecards, tee sheets, cart signs, bag tags, and related event reports. Our feature set also includes Dynamic Emails, Side Games, Payouts Calculator, and Calcutta & Parimutuel Betting.
Use the payout summary to present places and side games for committee approval. For leagues, prepare a standings-and-schedule sheet that remains useful beyond the current round. Dynamic Emails belong alongside these outputs as the communication carrying a tee time or a last-minute starting-hole change, not as a substitute for updating the underlying assignment.
Acceptance test: Remove a player, approve the revised pairing, and have a staff member regenerate all four pre-event printouts without outside help.
Check what they produce, not just whether they find the print button. The revised materials must agree, and obsolete copies must leave the staging area.
Why a License Does Not Mean the Numbers Get Used
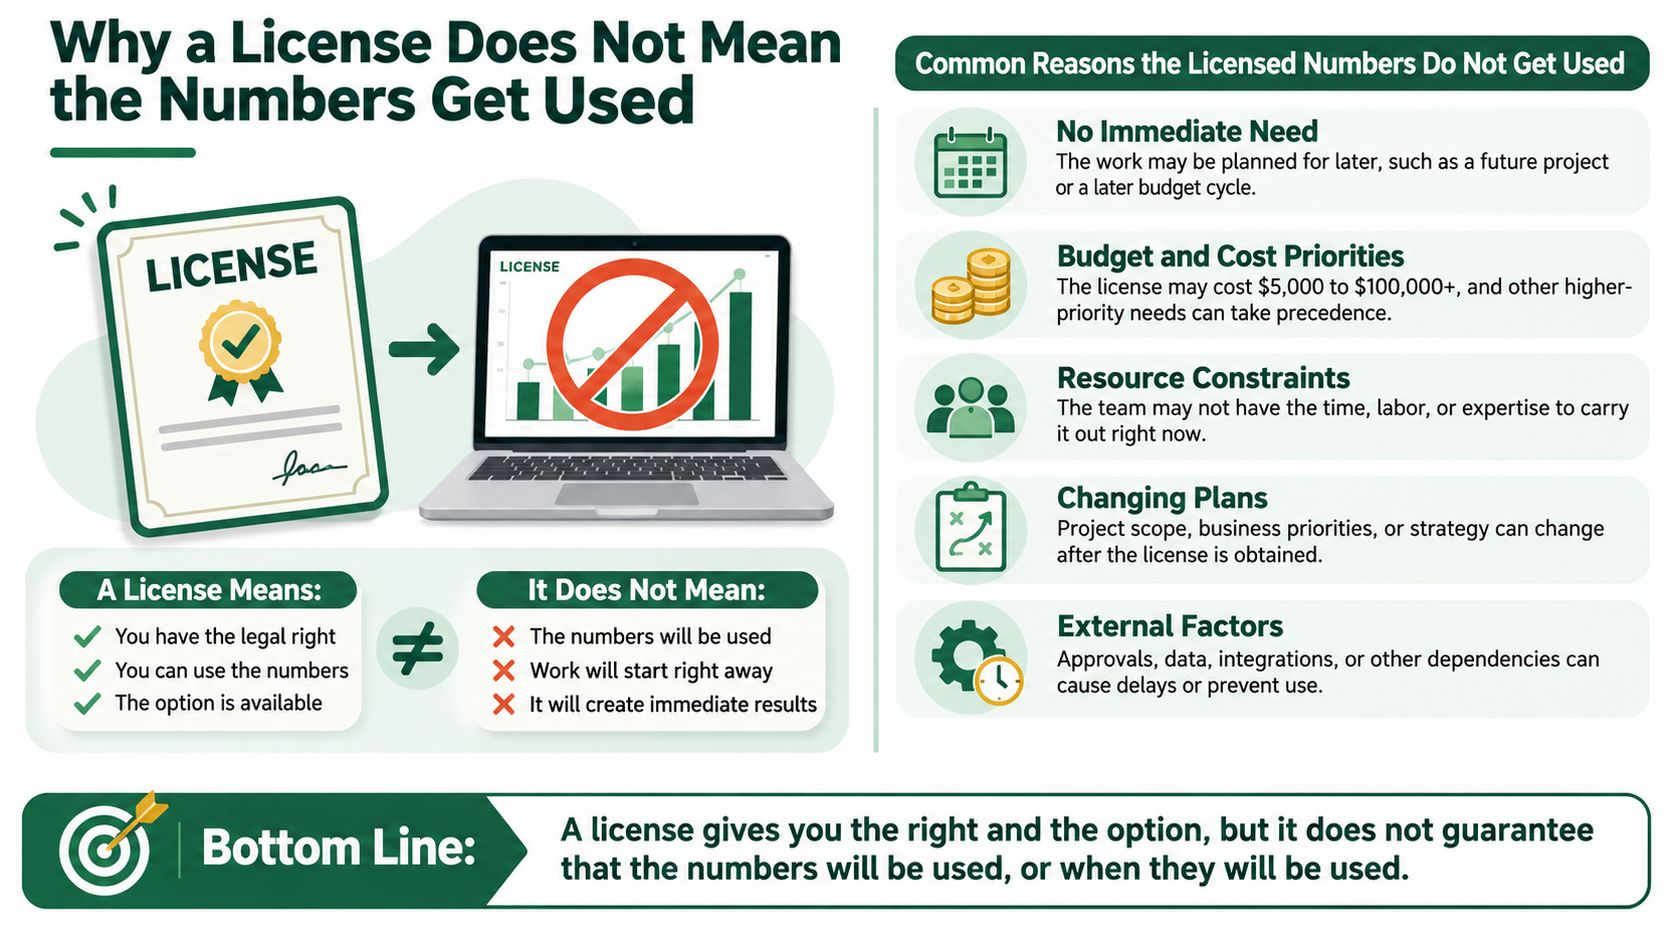
Buying access doesn't establish a working habit. Staff will abandon a tool if they have to verify every answer somewhere else before acting.
A worldwide BI survey summarized by G2 reported the following access and usage shares: 67% of employees had access, 25% used BI software daily, and regular use was 44% at smaller companies versus 16% at large enterprises.
BI access versus regular use
| Group | Measure | Share |
|---|---|---|
| All employees in the worldwide survey | Have access to BI tools | 67% |
| All employees in the worldwide survey | Use BI software daily | 25% |
| Employees at smaller companies | Regular BI use | 44% |
| Employees at large enterprises | Regular BI use | 16% |
Those measures aren't interchangeable, but they make the central point clear: availability and use are different outcomes. A successful rollout must fit the desk's work.
Establish who owns the answer
Late scores, ambiguous labels, and corrections nobody can trace are reasons to distrust a screen. Define who enters scores, who can approve changes, and how an accepted correction reaches the board.
The Elevated Signals dashboard guide identifies data quality, workflow fit, and maintenance demands as obstacles to useful reporting. A simpler system embedded in registration and scoring can be a better choice than a powerful platform requiring a separate cleanup process.
Evaluate operational proof rather than feature counts:
- Event creation. Time the work from an empty event to a usable setup.
- Roster import. Inspect rejected rows, duplicates, and missing fields.
- Score correction. Verify that the accepted score and live position agree.
- Payout explanation. Ask an assistant to explain the calculation without support.
Make these checks part of golf course management, with named responsibilities rather than a vague instruction to keep information current. Training should follow the tasks staff perform during a shift.
Test access beyond the login
Accessibility deserves the same practical scrutiny. The State of Analytics Governance report highlights accessibility shortcomings in public dashboards; a compliance claim alone isn't an acceptance test.
Use the leaderboard and scorecard without a mouse. Confirm that keyboard focus is visible, a screen reader can identify key values, and essential explanations don't require hovering. Provide an accessible table or downloadable equivalent for information shown in charts.
Unused software is a workflow and trust problem. Fix ownership, correctness, and access before asking staff to become more data-driven.
Pick Reporting Your Staff Will Open on Event Day
Choose for a shotgun start, not for a feature matrix. The right dashboard and reporting tools are the ones a starter and a part-time assistant can use while players are arriving and the radio is busy.
Keep the evaluation narrow. You're testing whether the software can carry an event's work, not whether the demonstration contains every possible chart.
Make the trial resemble your outing
Use these checks with your own roster, event format, and printer:
- Setup measured in minutes. Include the time needed to resolve import problems and confirm the starting structure.
- Phone-based live scoring. Have players open the scoring route without installing an app.
- Usable print jobs. Inspect the actual materials at the bag drop and starter's station.
- A controlled correction. Change an incorrect score and confirm that standings remain coherent.
- Event-week support. Use a real setup question to assess whether the response helps staff finish the task.
Live Tourney is built for this desk. Our Live Scoring provides real-time leaderboards and instant score updates with no app download, and we report 3X faster event setup and a 40% increase in live scoring participation. Treat those performance figures as vendor claims to test against your own event timings and participation, not guaranteed results.
We have no onboarding fee. Judge a short trial on a real outing rather than a scripted demonstration, and include the awkward work: a withdrawal, an incorrect score, and a committee member questioning an outcome.
Keep only what staff can operate
Skip tools that need a specialist for an ordinary tee-time change or cart-sign revision. Advanced capability is useful only when the people on duty can apply it.
Write down your priority views, run the upcoming event through the trial, and ask staff to produce the tee sheet, live board, and payout sheet without outside help. Keep the system only if the answers are correct and the staff responsible can explain them.
Live Tourney brings live scoring, customizable reports, registration and payments, and payout tools into the tournament workflow. Visit Live Tourney to try your upcoming outing with your own roster, then test the tee sheet, live leaderboard, and payout summary with the staff who'll run event day.